Real time acquisition and transmission of the data
On each ship, the thermosalinograph (TSG)-derived sea surface temperature (SST) and sea surface salinity (SSS) measurements are collected every 15 s. A median filter over 5 mn is applied to reduce small scale signal and/or noise. The 5 mn resolution data are recorded on the hard disk of a PC located on the ship bridge.
From the 5 mn median values sampled every hour, the acquisition station builds a message containing the measurements from the last 6 hours, together with GMT time, latitude and longitude recorded at the same time from a GPS. The acquisition station sends out the message which is recovered by satellite via the Iridium system.
Automatic processing
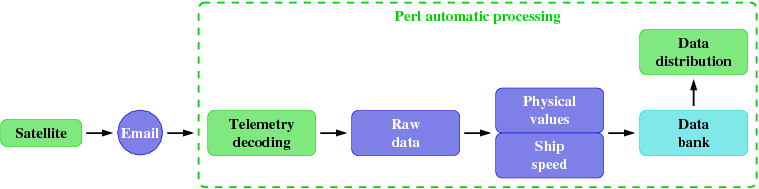
The message is then automatically sent to a dedicated email address at the LEGOS laboratory in Toulouse, France.
The received message automatically activates a software based on scripts written in Perl language. This software is designed so that one can add new thermosalinographs or integrate a new data transmission system without having to change the core of the program. About 30 emails are received each day from the thermosalinographs: the automatic processing is done about 30 times a day.
The software decodes the telemetry contained in the message and extracts the raw data. The physical values are computed from the raw data, then the ship speed is computed. All the automatic processing results are recorded in a data bank with the Berkeley DB format.
Chronograms
The chronograms are used during the automatic processing and the data visualization. They enable us to describe the state of the parameters at a given time and follow their temporal evolution. They describe:
- the type of sensor used;
- the measured parameters;
- the acquisition sampling rate;
and when all these parameters must be taken into account.
Automatic controls
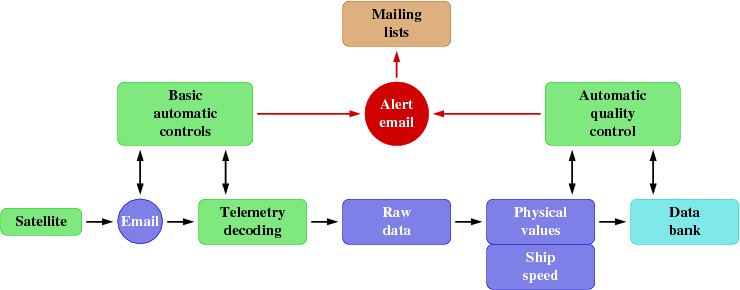
The automatic controls are used at each stage of the processing. Email is used as an alarm system to report potential problems to selected users in charge of the TSG Voluntary Observing Ship Program.
The basic automatic controls are performed during the message reception and the telemetry decoding.
During the message reception, an alert email is sent and the received message is not processed if:
- the message sender address is unknown;
- the email body is empty;
- the type of processing to be done cannot be identified (the processing sequence manages different formats of data transmission from tide gauges and thermosalinographs).
During the telemetry decoding, an alert email is sent if:
- the identification code and/or the radio code are unknown: the thermosalinograph is unknown (test #1 GOSUD). In this case the message is not processed;
- the dates and hours of measurement are unrealistic (test #2 GOSUD). In this case the line of the message is not processed;
- the telemetry format is unknown. In this case the message or line are not processed.
A preliminary quality control is automatically done and enables us to detect measurements out of climatic limits. An alert email is sent to the ship alert mailing list if the measurements are out of the following ranges (tests #3 and #6 GOSUD):-90° ≤ latitude ≤ +90°
-180° ≤ longitude ≤ +180°
1 PSS ≤ salinity ≤ 50 PSS
-5°C ≤ temperature ≤ 35°C
3 l/min ≤ flow ≤ 95 l/min
If the measurements are inside these limits, a processing code equal to 1 is associated with the measurements.
A processing code equal to 0 means that there is no precision concerning the measurements quality.
A second quality control is automatically done and enables us to compare salinity measurements with the salinity mean values of the World Ocean Atlas 2013 climatology (WOA 2013 SSS) between 0 and 10 m depth.
The temperature measurements are compared with the weekly mean values of the Reynolds Sea Surface Temperature (Reynolds SST) of the previous week (recovered automatically each week).
The range limits are the following (test #10 GOSUD):WOA 2013 SSS - 3 std. dev. ≤ salinity ≤ WOA 2013 SSS + 3 std. dev.
Reynolds SST - 3 std. dev. ≤ temperature ≤ Reynolds SST + 3 std. dev.
If the measurements are inside these limits, the processing code of measurements is equal to 2.
If the measurements are outside these limits, the processing code of measurements remains equal to 1.
If the processing code of a salinity measurement is equal to 1 or 2, the difference between this measurement and the corresponding WOA 2013 SSS mean value is computed.
If the processing code of a temperature measurement is equal to 1 or 2, the difference between this measurement and the corresponding Reynolds SST mean value is computed.
These processing codes of measurements and the differences with WOA 2013 SSS and Reynolds SST mean values are being integrated into the files distributed on the FTP site for Coriolis.
The WOA 2013 SSS and Reynolds SST mean values and standard deviations grids have been done in the following way:
- the WOA 2013 SSS mean values grid has been extracted from the 1° gridded WOA 2013 SSS monthly global climatology at 0, 5 and 10 m depth (levels 1, 2 and 3 respectively). Next, the average grids for levels 1, 2 and 3 were calculated over the period 2005-2012;
- the WOA 2013 SSS standard deviations grid has been done by computing the standard deviations over 12 months from the 1° gridded WOA 2013 SSS monthly values between 0 and 10 m depth over the months of January, February, etc, until December, from 1955-2012. Next, a bilinear interpolation in longitude/latitude, a linear temporal interpolation, and a linear smoothing in longitude, in latitude, and in time were performed;
- the Reynolds SST mean values weekly grids are extracted from the 1° gridded Reynolds SST weekly values global file, recovered automatically each week from the NOAA National Weather Service – Environmental Modelling Center site. The used values during a comparison are those of the previous week, the week in progress not being yet available;
- the 12 Reynolds SST standard deviations monthly grids have been done by computing the monthly standard deviations over the months of January, February, etc, until December, from 1982 to 2015, of the 1° gridded Reynolds SST data.
The WOA 2013 climatology is not interpolated on the continents. There are thus few data close to the coasts.
The Reynolds SST data are interpolated on the continents. There are thus data close to the coasts.
Reference for the WOA 2013 climatology: Zweng M. M., J. R. Reagan, J. I. Antonov, R. A. Locarnini, A. V. Mishonov, T. P. Boyer, H. E. Garcia, O. K. Baranova, D. R. Johnson, D. Seidov et al., 2013. World Ocean Atlas 2013, Volume 2, Salinity, NOAA Atlas NESDIS 74.
Reference for the Reynolds SST (Optimally Interpolated version 2 SST reanalysis): Reynolds R. W., N. A. Rayner, T. M. Smith, D. C. Stokes and W. Wang, 2002. An improved in situ and satellite SST analysis for climate. Journal of Climate, Volume 15, Issue 13, Pages 1609–1625, https://doi.org/10.1175/1520-0442(2002)015<1609:AIISAS>2.0.CO;2
An additional automatic control, using a Perl script executed each hour, checks when data were last received: an alert email is sent to the ship alert mailing list if no measurement has arrived for more than 2 days. A recall email is sent if no measurement has arrived for more than 4 days.
Real time monitoring
The visualization of the real time monitoring of the measurements is available to selected people on the LEGOS web site. The Perl language is also used in the various steps of the Internet monitoring.
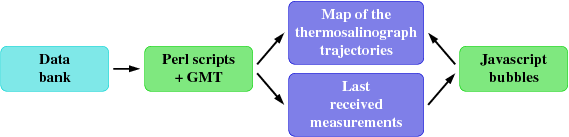
A map of the thermosalinograph trajectories for the past 15 days is plotted each hour with a Perl script which calls GMT graphic library functions. By moving the mouse over the last thermosalinograph positions, one can access information on the latest received measurements. There are updated each hour with a Perl script (at the same time as the map) and displayed in a bubble with a Javascript code.
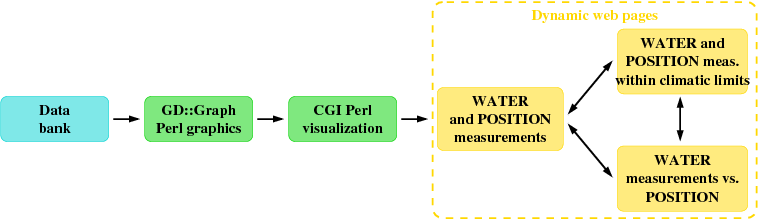
When clicking on the lastest ship’s position on the map, or on the ship’s name in the list, one can access the real time monitoring of the thermosalinograph over the past 15 days: the data bank is read, graphics are plotted with the GD::Graph Perl module. Data visualization is generated by a CGI Perl module which integrates style sheets and displays dynamic web pages. The thermosalinograph measurements appear in different formats on different pages: the temporal evolution along the ship’s path in the WATER and POSITION measurements, and the WATER and POSITION measurements within climatic limits pages; and the spatial evolution in the WATER measurements vs. POSITION page.
For each ship, important information for an operational monitoring of the thermosalinograph and in situ interventions are shown on the WATER and POSITION measurements page: time plots of measured seawater salinity and temperature, latitude, longitude and estimated ship speed are displayed. The date of the last processing shows when the last message was received. For each sensor, the number of values and the dates of the first and last measurements for the past 15 days are displayed above the plots. The minimum, maximum and last values are displayed below the plots. The last value corresponds to the end date of the time series.
When clicking on the WATER and POSITION measurements within climatic limits link, one can access a similar web page with time plots of measurements within climatic limits (processing code >= 1), on which are superimposed:
- for salinity: the WOA 2013 SSS mean values plot (mean between 0 and 10 m depth) and the WOA 2013 SSS mean values plots (mean between 0 and 10 m depth) +/- 3 std. dev. Time plot of differences (ranging between -2 and +2 PSS) between salinity measurements and the WOA 2013 SSS mean values is displayed above;
- for temperature: the Reynolds SST weekly mean values plot (of the previous week) and the Reynolds SST weekly mean values plots (of the previous week) +/- 3 std. dev. Time plot of differences (ranging between -2 and +2 °C) between temperature measurements and the Reynolds SST weekly mean values is displayed above.
When clicking on the WATER measurements vs. POSITION link, one can access a similar web page with measured salinity and temperature plotted as a function of latitude and longitude.
Quality indicators
Quality indicators, updated automatically each month, are available on public access on the LEGOS web site and enable us to oversee, on the long run, the quality evolution of the received real time measurements:
- annual and multiannual maps of the spatial distribution of salinity measurements since 1998;
- a chronogram, based on the Image::Timeline Perl module, of the temporal distribution of salinity measurements acquisition periods per ship since 1998;
- an array of the number of salinity measurements received and processed at LEGOS, per ship, per year and total since 1998;
- an array of statistics about the number of received messages, the number of sent alerts when measurements are out of climatic limits and the number of salinity measurements out of climatic limits per ship, per year and total since 2007;
- an array of statistics about the number of sent messages during the ship cruises and comparison between sent messages and those received at LEGOS per ship, per year and total since 2008.