Real time acquisition and transmission of the data
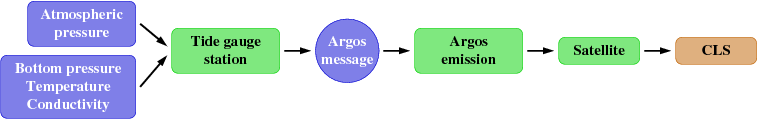
On each site, the tide gauge station automatically acquires hourly measurements of seawater bottom pressure (Pb), temperature and conductivity together with atmospheric pressure (Pa) triggered at the same time.
The tide gauge station builds an Argos message containing the measurements from the last 7 hours and sends out the message every 200 seconds. This message is recovered by satellite via the Argos system and is transmitted to the CLS processing center in Toulouse, France.
Automatic processing
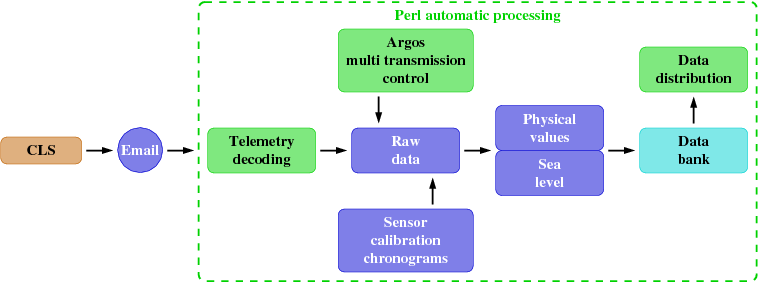
The message is then automatically sent to a dedicated email address at the LEGOS laboratory in Toulouse.
The received Argos message automatically activates a software based on scripts written in Perl language. This software is designed so that one can add new tide gauges or integrate a new data transmission system without having to change the core of the program. About 200 emails are received each day from the tide gauges: the automatic processing is done about 200 times a day.
The software decodes the telemetry contained in the Argos message and extracts the raw data. The multi transmission of the data by the Argos system is used to control the quality: the number of times the data appear with the same date and hour in several messages is computed. For each sensor, the value repeated the biggest number of times is kept.
The physical values are computed from the raw data using the calibration chronograms of the sensors. From the measurements simultaneously acquired by the tide gauge station, the seawater salinity and density are computed using the UNESCO algorithms. Then the sea level is computed from the atmospheric pressure, seawater bottom pressure, density (rho) and gravity (g):
height = ( Pb – Pa ) / ( rho * g )
All the automatic processing results are recorded in a data bank with the Berkeley DB format.
Chronograms
The chronograms are used during the automatic processing and the data visualization. They enable us to describe the state of the parameters at a given time and follow their temporal evolution. They describe:
- the type of tide gauge station used;
- the type of sensor used;
- the measured parameters;
- the acquisition sampling rate;
- the sensor calibration sheets;
and when all these parameters must be taken into account.
This enables us to follow in real time the equipment evolution. As all the modifications and equipment changes are described in the chronograms, it will be easier to recompute the historical data.
Automatic controls
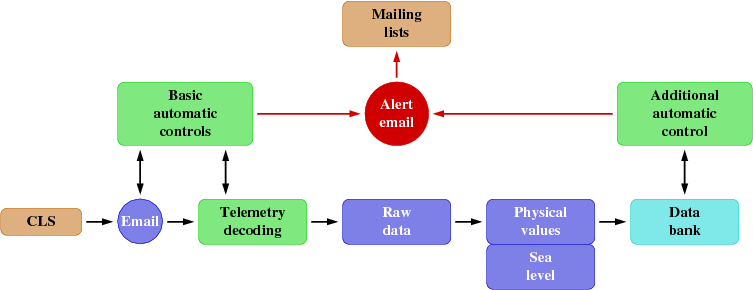
The automatic controls are used at each stage of the processing. Email is used as an alarm system to report potential problems to selected users in charge of the tide gauge stations.
The basic automatic controls are performed during the message reception and the telemetry decoding. They are based on GOSUD tests.
During the message reception, an alert email is sent and the received message is not processed if:
- the message sender address is unknown;
- the email body is empty;
- the type of processing to be done cannot be identified (the processing sequence manages different formats of data transmission from tide gauges and thermosalinographs).
During the telemetry decoding, an alert email is sent and the received Argos message is not processed if:
- the program number and/or the beacon number are unknown: the tide gauge is unknown;
- the dates and hours of satellite passage or measurement are unrealistic;
- the telemetry format is incomplete;
- an initialisation message from the tide gauge station is received.
An additional automatic control, using a Perl script executed each hour, checks when data were last received: an alert email is sent if no measurement has arrived for more than 24 hours. A recall email is sent if no measurement has arrived for more than 48 hours.
Quality control and validation
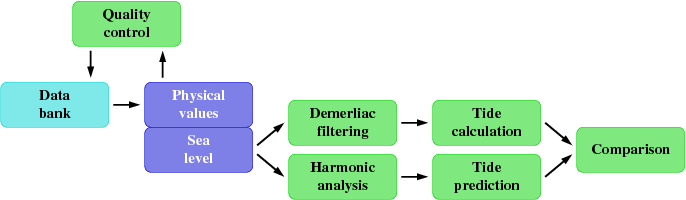
In more of the automatic control which consists in using the multi transmission by the Argos system to control the quality of the received data, a quality control is done on the physical data and enables us to detect the peaks in the measurements.
A new quality control will soon enable us to automatically compare physical data to climatic limits. An alert email will be sent if the values are out of thresholds.
After the quality control, a sea level validation is done and consists in filtering the sea level with a Demerliac filter to obtain a low frequency signal. The difference between the sea level and the low frequency signal gives a high frequency signal, that is mainly tide. The harmonic analysis of the sea level is done. A tide prediction is computed from the analysis harmonic constants. The predicted tide and the computed tide are compared: the differences must be tiny.
Real time monitoring
The visualization of the real time monitoring of the measurements is available on the LEGOS web site. The Perl language is also used in the various steps of the Internet monitoring.
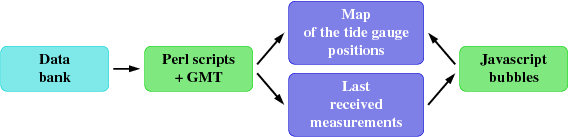
A map of the tide gauge positions was plotted with a Perl script which calls GMT graphic library functions. By moving the mouse over the tide gauge positions, one can access information on the lastest received measurements. There are updated each hour with a Perl script and displayed in a bubble with a Javascript code.
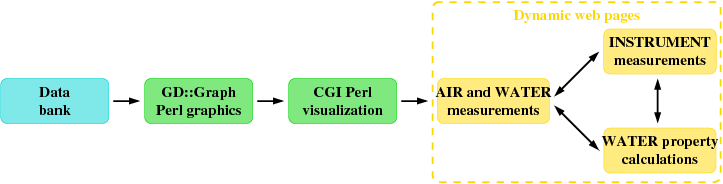
When clicking on a tide gauge position on the map, or on the tide gauge station name in the list, one can access the real time monitoring of the tide gauge over the past 15 days: the data bank is read, graphics are plotted with the GD::Graph Perl module. Data visualization is generated by a CGI Perl module which integrates style sheets and displays dynamic web pages. The temporal evolution of the tide gauge measurements appear in the AIR and WATER measurements and INSTRUMENT measurements pages. The calculations from the measurements are in the WATER property calculations page.
For each site, important information for an operational monitoring of the tide gauge station and in situ interventions are shown on the AIR and WATER measurements page: time plots of measured atmospheric pressure, seawater bottom pressure, temperature and conductivity are displayed. The date of the last processing shows when the last Argos message was received. For each sensor, the number of values and the dates of the first and last measurements for the past 15 days are displayed above the plots. The minimum, maximum and last values are displayed below the plots. The last value corresponds to the end date of the time series. The time plot of the number of repeats in the Argos messages appears above each time plot of measurements as an additional information about the quality of the received data.
When clicking on the INSTRUMENT measurements link, one can access a similar web page with time plots of instrument parameters (battery voltage, station temperature, memory used). When clicking on the WATER property calculations link, one can access a similar web page with time plots of the values computed from the measurements (seawater salinity and density, sea level).
A new web page will soon allow us to visualize only physical data which are within the climatic limits.
Quality indicators
Quality indicators, updated each month, are available on the LEGOS web site and enable us to oversee, on the long run, the quality evolution of the received real time and delayed time data:
– chronograms, based on the Image::Timeline Perl module, of the temporal distribution of sea level observations acquisition periods for each coastal tide gauge station since 1993 and for each pelagic tide gauge station since 1986;
– arrays of the number of days of sea level observations for each coastal tide gauge station, per year and total since 1993, and for each pelagic tide gauge station, per year and total since 1986;
– the monitoring of Kerguelen coastal tide gauges references: tide pole readings are done during several hours each month at Kerguelen. Once these measurements received at LEGOS, an automatic processing do: the computing of the hourly mean values and standard deviations of each time series, then the differences between the hourly mean values of the tide pole readings and the real time measurements, and finally the computing and the plot of the daily mean values and standard deviations of the differences.